Python - ディープラーニング - 論理演算
公開日:2019-08-31
更新日:2019-08-31
更新日:2019-08-31
1. 概要
多層パーセプトロンで論理演算(AND, OR, XOR)が再現できるのかどうかの検証です。
2. 動画
3. 多層パーセプトロンによる論理演算の検証
多層パーセプトロンで論理演算(AND, OR, XOR)が再現できるのかどうかの検証です。
今回は、ランダムで重みとバイアスを設定して、何度もループして、重みとバイアスを探します。
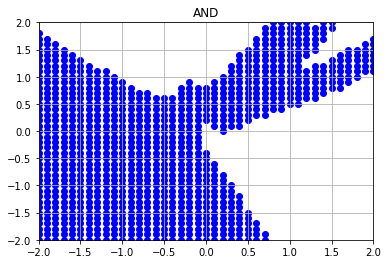
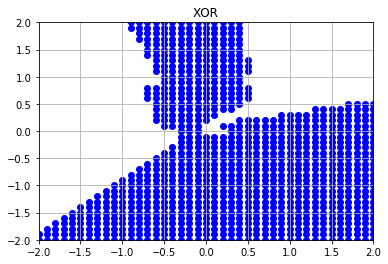
AND と OR は単純パーセプトロンで論理演算が再現できましたが、XOR は行えませんでした。
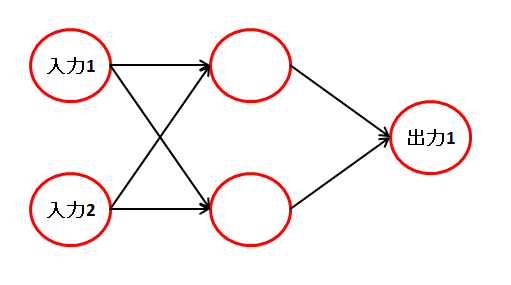
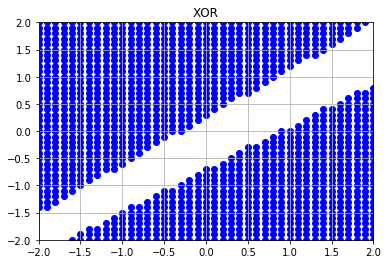
そこで、中間層を追加して多層パーセプトロンにしたところ、XOR の再現ができるようになりました。 層を増やすことで、問題を解決できる幅が広がることがわかります。
XOR のニューラルネットワーク

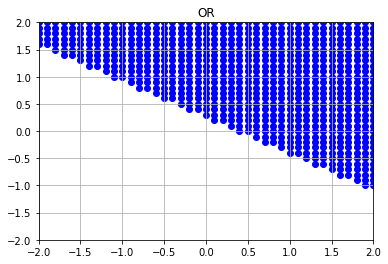
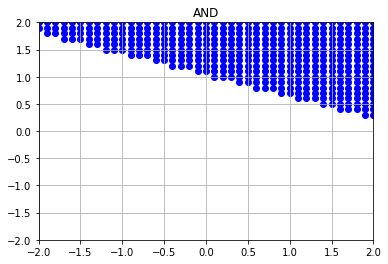
実行結果
今回は、ランダムで重みとバイアスを設定して、何度もループして、重みとバイアスを探します。
import matplotlib.pyplot as plt
import numpy as np
# 活性化関数(出力層用)
def step(x):
if x > 0:
return 1
else:
return 0
# 活性化関数(中間層用)
def relu(x):
if x > 0:
return x
else:
return 0
# 予測する
def predict(layer, v1, v2, w1, w2, w3, w4, w5, w6, b1, b2, b3):
# and と or
if layer == 2:
# 出力層の計算
v3 = (v1 * w1) + (v2 * w2) + b1
# 活性化関数の実行
return step(v3)
# xor
if layer == 3:
# 中間層の計算
v3 = (v1 * w1) + (v2 * w3) + b1
v4 = (v1 * w2) + (v2 * w4) + b2
# 活性化関数の実行
v3 = relu(v3)
v4 = relu(v4)
# 出力層の計算
v5 = (v3 * w5) + (v4 * w6) + b3
# 活性化関数の実行
return step(v5)
# 重みをランダムで生成して、論理演算が行える重みを探して返します
def get_weight(layer, result_list):
for _ in range(0, 100000): # 見つからない場合、増やす
# 重みをランダムで設定
w1 = np.random.rand() - 0.5
w2 = np.random.rand() - 0.5
w3 = np.random.rand() - 0.5
w4 = np.random.rand() - 0.5
w5 = np.random.rand() - 0.5
w6 = np.random.rand() - 0.5
# バイアス
b1 = np.random.rand() - 0.5
b2 = np.random.rand() - 0.5
b3 = np.random.rand() - 0.5
# 引数用
param = (w1, w2, w3, w4, w5, w6, b1, b2, b3)
# if predict(layer, 0, 0, w1, w2, w3, w4, w5, w6, b1, b2, b3) == result_list[0] and \
# 入力値
if predict(layer, 0, 0, *param) == result_list[0] and \
predict(layer, 0, 1, *param) == result_list[1] and \
predict(layer, 1, 0, *param) == result_list[2] and \
predict(layer, 1, 1, *param) == result_list[3]:
return (w1, w2, w3, w4, w5, w6, b1, b2, b3)
return None #見つからなかった場合
# グラフの描画
def draw_graph(title, layer, w1, w2, w3, w4, w5, w6, b1, b2, b3):
plt.title(title) # タイトル
plt.grid() # グリッド表示
plt.xlim([-2, 2]) # グラフ描画範囲(X軸)
plt.ylim([-2, 2]) # グラフ描画範囲(Y軸)
# グラフ描画
x_list = np.arange(-2, 2.1, 0.1) # x軸
y_list = np.arange(-2, 2.1, 0.1) # y軸
for y in y_list:
for x in x_list:
if predict(layer, x, y, w1, w2, w3, w4, w5, w6, b1, b2, b3) == 1:
plt.scatter(x, y, c = 'b')
plt.show()
layer = 2
result = get_weight(layer, [0, 1, 1, 1])
if result != None:
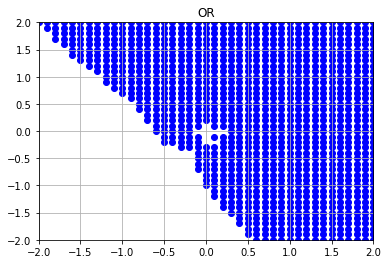
draw_graph('OR', layer, *result)
layer = 2
result = get_weight(layer, [0, 0, 0, 1])
if result != None:
draw_graph('AND', layer, *result)
# XOR の場合は、3層にしないと見つからない
layer = 3
result = get_weight(layer, [0, 1, 1, 0])
if result != None:
draw_graph('XOR', layer, *result)
AND と OR は単純パーセプトロンで論理演算が再現できましたが、XOR は行えませんでした。
そこで、中間層を追加して多層パーセプトロンにしたところ、XOR の再現ができるようになりました。 層を増やすことで、問題を解決できる幅が広がることがわかります。
XOR のニューラルネットワーク
実行結果
4. 中間層のユニット数(ノード数)の変更
中間層のユニット数を増やして、結果への影響を調べます。
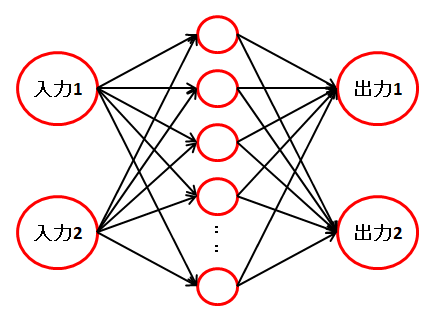
ニューラルネットワークは以下のようになります。
また、ソフトマックス関数の使用例としても使いたいため、出力を 2 つに変更しました。
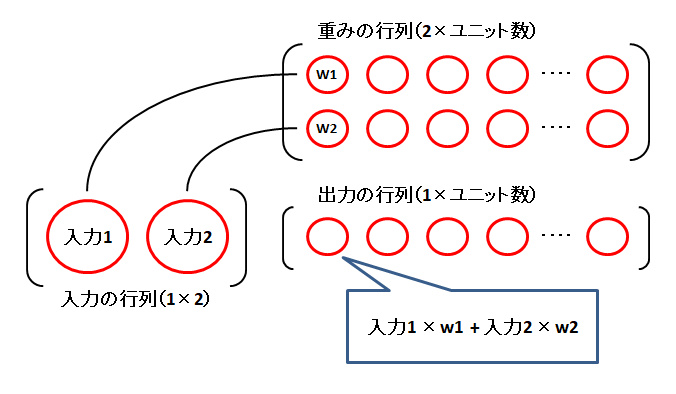
中間層の計算は、任意のユニット数で計算できるようにするため、行列を使って計算します。
入力層から中間層の算出
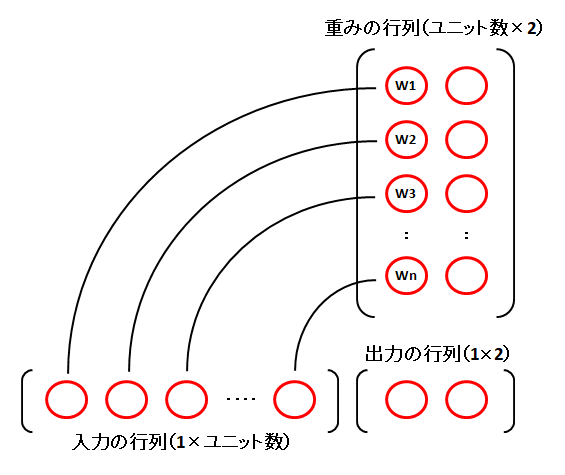
中間層から出力層の算出
実行結果
中間層のユニット数を増やすと、表現の幅がさらに広がることがわかります。
ニューラルネットワークは以下のようになります。
また、ソフトマックス関数の使用例としても使いたいため、出力を 2 つに変更しました。
中間層の計算は、任意のユニット数で計算できるようにするため、行列を使って計算します。
入力層から中間層の算出
中間層から出力層の算出
import matplotlib.pyplot as plt
import numpy as np

# 活性化関数(中間層用)
def relu(lst):
    lst[lst < 0] = 0

# 活性化関数(出力層用)
def softmax(lst):

    # リストの全要素に対して exp() を実行する
    exp_lst = np.exp(lst - np.max(lst))
    # RuntimeWarning: invalid value encountered in true_divide
    #exp_lst = np.exp(lst)

    # リストの全要素の合計を算出する
    exp_sum = np.sum(exp_lst)

    # リストの全要素を、上記の合計値で割る
    result_lst = exp_lst / exp_sum

    return result_lst

# 予測する
def predict(v_list, w_list1, w_list2, b1, b2):

    v_list = np.dot(v_list, w_list1) + b1
    relu(v_list)

    v_list = np.dot(v_list, w_list2) + b2
    #relu(v_list)

    # 2つの出力のうち、大きい方を採用する
    return np.argmax(softmax(v_list[0]))

# 重みをランダムで生成して、論理演算が行える重みを探して返します
def get_weight(result_list):

    for _ in range(0, 100000): # 見つからない場合、増やす

        unit = 1024 # ユニット数(ノード数)
        w_list1 = np.random.randn(2   , unit) - 0.5
        w_list2 = np.random.randn(unit, 2)    - 0.5
        b1 = np.random.rand() - 0.5
        b2 = np.random.rand() - 0.5

        if predict(np.array([[0, 0]]), w_list1, w_list2, b1, b2) == result_list[0] and \
           predict(np.array([[0, 1]]), w_list1, w_list2, b1, b2) == result_list[1] and \
           predict(np.array([[1, 0]]), w_list1, w_list2, b1, b2) == result_list[2] and \
           predict(np.array([[1, 1]]), w_list1, w_list2, b1, b2) == result_list[3]:
            return (w_list1, w_list2, b1, b2)

    return None #見つからなかった場合

# グラフの描画
def draw_graph(title, w_list1, w_list2, b1, b2):
    plt.title(title)  # タイトル
    plt.grid()        # グリッド表示
    plt.xlim([-2, 2]) # グラフ描画範囲(x軸)
    plt.ylim([-2, 2]) # グラフ描画範囲(y軸)

    # グラフ描画
    x_list = np.arange(-2, 2.1, 0.1) # x軸
    y_list = np.arange(-2, 2.1, 0.1) # y軸
    for y in y_list:
        for x in x_list:
            if predict(np.array([[x, y]]), w_list1, w_list2, b1, b2) == 1:
                plt.scatter(x, y, c = 'b')

    plt.show()


result = get_weight([0, 1, 1, 1])
if result != None:
    draw_graph('OR', *result)

result = get_weight([0, 0, 0, 1])
if result != None:
    draw_graph('AND', *result)

result = get_weight([0, 1, 1, 0])
if result != None:
    draw_graph('XOR', *result)
実行結果
中間層のユニット数を増やすと、表現の幅がさらに広がることがわかります。

